Group Financial Highlights
Income Statement: Q3 2019 vs. Q3 2018
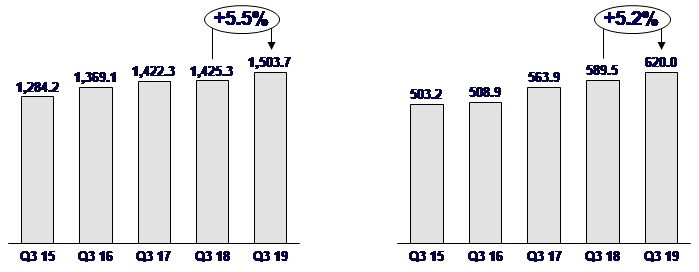
- Group net revenues for Q3 2019 increased by 5.5% to AED 1,503.7 million vs. AED 1,425.3 million in Q3 2018.
- Operating profit (margin) grew 8.7% to AED 828.9 million vs. AED 762.7 million in Q3 2018.
- Group net profit for Q3 2019 increased by 5.2% to AED 620.0 million vs. AED 589.5 million in Q3 2018.
- Credit provisions and impairments for Q3 2019 increased by 20.8% to AED 207.5 million vs. AED 171.7 million for Q3 2018.
Income Statement: 9 months of 2019 vs. 9 months of 2018 - Group net revenues for the first nine months of 2019 increased by 5.7% to AED 4,390.9 million vs. AED 4,154.1 million in first nine months of 2018.
- Operating profit (margin) grew 7.2% to AED 2,405.4 million vs. AED 2,243.4 million in first nine months of 2018.
- Group net profit for the first nine months of 2019 increased by 5.6% to AED 1,850.5 million vs. AED 1,752.5 million in first nine months of 2018.
- Credit provisions and impairments for the first nine months of 2019 increased by 13.4% to AED 552.5 million vs. AED 487.0 million in first nine months of 2018.
Balance Sheet: 30 September 2019 vs. 30 September 2018 and 31 December 2018 - Total assets as of 30 September 2019 were AED 124.3 billion, with no change on the AED 124.3 billion reported at the end of 30 September 2018 (and a decrease of 0.7% from AED 125.2 billion at 31 December 2018).
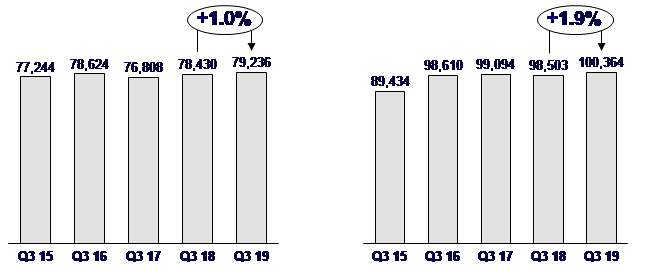
- Net customer financing increased by 1.0% to AED 79.2 billion, from AED 78.4 billion at the end of 30 September 2018 (and increased 0.7% from AED 78.7 billion at 31 December 2018).
- Customer deposits increased by 1.9% to AED 100.4 billion, from AED 98.5 billion at the end of 30 September 2018 (with no change on the AED 100.4 billion reported at 31 December 2018).
Capital adequacy and liquidity:
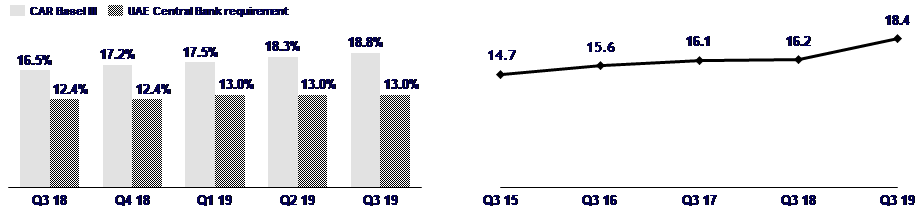
30 September 2019 vs. 30 September 2018 and 31 December 2018 - The capital adequacy ratio under Basel III at 30 September 2019 was 18.84% vs. 16.45% at 30 September 2018, (31 December 2018 was 17.18%, after adjusting for the 2018 dividend).
- ADIB remains one of the most liquid banks in the UAE, with an advances to stable funds ratio (a regulatory ratio) of 83.9% at 30 September 2019, vs. 85.4% at 30 September 2018 (82.9% at 31 December 2018) and an advances to deposits ratio of 78.9% at 30 September 2019, vs. 79.6% at 30 September 2018 (78.4% at 31 December 2018).
Group Financial highlights – Four-year performance
|
As at 30 September |
All figures are in AED millions |
|
Balance sheet |
Q3 2016 |
Q3 2017 |
Q3 2018 |
Q3 2019 |
3 YR (CAGR) |
| Total assets | 122,589 | 121,269 | 124,290 | 124,285 | 0.5% |
| Gross customer financing | 81,869 | 79,937 | 81,842 | 82,310 | 0.2% |
| Customer deposits | 98,610 | 99,094 | 98,503 | 100,364 | 0.6% |
| Total equity | 15,593 | 16,142 | 16,189 | 18,383 | 5.6% |
| Customer financing to deposit ratio | 79.7% | 77.5% | 79.6% | 78.9% | |
|
Income statement |
Q3 2016 |
Q3 2017 |
Q3 2018 |
Q3 2019 |
3 YR (CAGR) |
| Net revenue | 1,369.1 | 1,422.3 | 1,425.3 | 1,503.7 | 3.2% |
| Operating profit (margin) | 780.9 | 812.9 | 762.7 | 828.9 | 2.0% |
| Credit provisions and impairment charge | 267.7 | 242.7 | 171.7 | 207.5 | -8.1% |
| Net profit after zakat & tax | 508.9 | 563.9 | 589.5 | 620.0 | 6.8% |
| Stage 3 financing to gross financing assets ratio | 4.4% | 5.1% | 5.5% | 5.0% | |
| Cost to income ratio | 43.0% | 42.8% | 46.5% | 44.9% | |
Abu Dhabi, UAE – 7 November 2019: Abu Dhabi Islamic Bank (ADIB), a leading Islamic bank in the region, posted a 5.2% increase in net profit to AED 620.0 million for Q3 2019 and a 5.6% growth for the first nine months of 2019 to AED 1,850.5 million. Operating Profit grew 8.7% to AED 828.9 million vs. AED 762.7 million in Q3 2018 driven a rise in net customer financing to AED 79.2 billion in the first nine months and a growth in non-financing income on the back of higher investment income, which was up 58.9% to AED 195.0 million in Q3 2019, and a 5.1% rise in fees & commission to AED 280.0 million.
Key business highlights for Q3 2019:
- Net customer financing increased by 1.0% to AED 79.2 billion at 30 September 2019, from AED 78.4 billion a year earlier.
- Net revenues increased by 5.5% to AED 1,503.7 million due to 58.9% growth in investment income and 5.1% rise in fee income.
- Net Profit Margin was at 4.22% despite the lower rates in the market helped by the positive impact of the low cost of fund.
- Cost discipline initiatives saw the cost to income ratio decreased by 1.6% year on year despite the investments in digital and strategic initiatives that was done in order to support future business growth and improvements in the customer experience.
- ADIB's capital adequacy ratio under Basel III as at 30 September 2019 was 18.84%; the Tier 1 capital ratio was 17.74% and the common equity Tier 1 ratio stood at 13.03%.
- Impairment and provisions for Q3 2019 increased by 20.8% to AED 207.5 million with cost of risk increasing to an annualised 101 bps.
|
|
Group net profit – AED million |
Group net revenues – AED million |
Risk management
As per IFRS 9, customer financing that is classified under Stage 3 stands at 5.0% with these assets now totaling AED 4,141.5 million. Furthermore, total credit provisions held under IFRS 9 stood at AED 3,074.1 million at the end of Q3 2019. Credit provisions and impairments for the first nine months of 2019 increased by 13.4% to AED 552.5 million vs. AED 487.0 million for the first nine months of 2018.
Asset and Liability Management
ADIB recorded a healthy customer financing-to-deposits ratio of 78.9% as at 30 September 2019. The bank maintained its position as one of the most liquid financial institutions in the UAE. Customer financing assets increased 1.0% year on year, while ADIB continued to focus on effective risk management.
|
|
Net Customer Financing Growth – AED million |
Customer Deposit Growth - AED million |
Capital strength
Total equity (including Tier 1 capital instruments) was AED 18.4 billion at 30 September 2019. This represents an increase of 13.6% year-on-year and a 3-year compounded growth rate of 5.6%.
ADIB's capital adequacy ratio under Basel III as at 30 September 2019 was 18.84%, while its Tier 1 capital ratio was at 17.74% and its common equity Tier 1 ratio stood at 13.03%. All capital ratios under Basel III principles are above the minimum regulatory thresholds advised by Central Bank of the UAE.
|
|
Capital Adequacy Ratio - % |
Total Equity – AED billion |
Cost management
ADIB is focused on putting in place the necessary infrastructure to support its growth strategy. Specifically, ADIB has continued to enhance its digital capabilities across all businesses and processes. The bank is enhancing service and convenience, while building and diversifying its fee income capabilities in line with identified customer needs.
ADIB is also upgrading all aspects of its infrastructure to ensure the bank functions efficiently in a stable and secure operating environment. Despite making these investments, the cost-to-income decreased to 44.9% in Q3 2019 vs. 46.5% in Q3 2018.
Management comment
On behalf of the Board of Directors and the management team, Mr. Mazin Manna, ADIB Group CEO, said: "Our financial and operational performance in the third quarter of 2019 reflects the effective execution of our strategy. ADIB's operating profit increased by 8.7% year-on-year in Q3 2019 supported by growth in income from financing, and higher investment and fee income. This led to a healthy return on equity of 18.0%. Our Q3 net profit increased by 5.2% to AED 620.0 million after increasing our credit provisions and impairments by 20.8% to AED 207.5 for Q3 2018. '
"Despite a low rate market environment our net profit margins 'NPMs' was at 4.22% helped by the positive impact of the low cost of fund that is supported by higher CASA balances. Our liquidity also remains strong, with an advances-to-deposits ratio of 78.9%. We therefore fully expect to be able to support our growth ambitions in the most effective and efficient manner."
"Our growth in revenues has been complemented by our discipline in managing costs and risk which saw the cost to income ratio decrease by 1.6% year on year. We have implemented a number of savings initiatives that have controlled operating expenses without compromising our performance or quality of service. However, the financial benefits of this programme have been partially offset by investments in new digital and strategic initiatives that will help to attract new customers and support the future growth of the Bank."
"We have made exciting progress in advancing our digital transformation strategy. The Bank further enhanced its digital proposition and client experience by collaborating with Samsung Pay for contactless payment. Moreover, the launch of the Express Finance service, which provides qualifying customers with instant access to personal finance, and ADIB Direct, a new digital banking platform for businesses, are two examples of ADIB incorporating technology to positively transform our customers' banking experience."
Gratitude
The Board of Directors and executive management wish to extend their sincere appreciation and gratitude to His Highness Sheikh Khalifa Bin Zayed Al Nahyan, the President of the UAE and Ruler of Abu Dhabi, to His Highness Sheikh Mohammed Bin Zayed Al Nahyan, Abu Dhabi Crown Prince and Deputy Supreme Commander of the UAE Armed Forces, to the Central Bank of the UAE and to the Emirates Securities and Commodities Authority, our shareholders and our clients for their continued trust in and support of ADIB, along with our staff for their dedication.
_________________
Mazin Manna
Group Chief Executive Officer
Financial summaries
ADIB Group Financial summary –
3 months and 9 months summary
|
|
Consolidated Group |
|
Financials |
Q3 2017 |
Q3 2018 |
Q3 2019 |
Chg Q3 18 vs. Q3 17 |
Chg Q3 19 vs. Q3 18 |
YTD 2017 |
YTD 2018 |
YTD 2019 |
Chg YTD 18 vs. YTD 17 |
Chg YTD 19 vs. YTD 18 |
| |
AED Mn |
AED Mn |
AED Mn |
% |
% |
AED Mn |
AED Mn |
AED Mn |
% |
% |
| Net Revenue from Funding | 961.9 | 951.1 | 948.2 | -1.1% | -0.3% | 2,834.6 | 2,828.6 | 2,865.2 | -0.2% | 1.3% |
| Fees & Commissions | 248.0 | 266.4 | 280.0 | 7.4% | 5.1% | 747.0 | 744.2 | 747.7 | -0.4% | 0.5% |
| Investment income | 146.6 | 122.7 | 195.0 | -16.3% | 58.9% | 398.8 | 364.2 | 542.2 | -8.7% | 48.9% |
| FX | 65.7 | 78.5 | 79.2 | 19.6% | 0.9% | 213.9 | 197.9 | 228.7 | -7.5% | 15.6% |
| Other | 0.2 | 6.6 | 1.3 | 3909.1% | -79.5% | 10.0 | 19.2 | 7.0 | 91.8% | -63.4% |
|
Total Revenues |
1,422.3 |
1,425.3 |
1,503.7 |
0.2% |
5.5% |
4,204.4 |
4,154.1 |
4,390.9 |
-1.2% |
5.7% |
|
Total Expenses |
609.4 |
662.6 |
674.8 |
8.7% |
1.8% |
1,864.8 |
1,910.8 |
1,985.5 |
2.5% |
3.9% |
|
Operating profit (margin) |
812.9 |
762.7 |
828.9 |
-6.2% |
8.7% |
2,339.6 |
2,243.4 |
2,405.4 |
-4.1% |
7.2% |
| Credit Provisions and Impairment | 242.7 | 171.7 | 207.5 | -29.2% | 20.8% | 623.4 | 487.0 | 552.5 | -21.9% | 13.4% |
|
Net Profit before Zakat & Tax |
570.2 |
591.0 |
621.4 |
3.6% |
5.2% |
1,716.2 |
1,756.4 |
1,852.9 |
2.3% |
5.5% |
| Zakat & Tax |
6.3 |
1.5 |
1.4 | -76.3% | -6.3% |
23.2 |
3.9 |
2.4 | -83.2% | -38.2% |
|
Net Profit after Zakat & Tax |
563.9 |
589.5 |
620.0 |
4.5% |
5.2% |
1,693.0 |
1,752.5 |
1,850.5 |
3.5% |
5.6% |
| Total Assets (in AED Billion) | 121.3 | 124.3 | 124.3 | 2.5% | 0.0% | 121.3 | 124.3 | 124.3 | 2.5% | 0.0% |
| Customer Financing (in AED Billion) | 76.8 | 78.4 | 79.2 | 2.1% | 1.0% | 76.8 | 78.4 | 79.2 | 2.1% | 1.0% |
| Customer Deposits (in AED Billion) | 99.1 | 98.5 | 100.4 | -0.6% | 1.9% | 99.1 | 98.5 | 100.4 | -0.6% | 1.9% |